I’ve been following Christopher S. Penn for years and am a big advocate for listening to his weekly podcast with John Wall called Marketing Over Coffee.
I learned how to set up a custom dashboard in Google from Chris so some of this custom dashboard set-up comes from him, a few others and my own added info. So props to Christopher for showing me how to do this so I can show you how to set up your dairy website/blog analytics?
Before you set up your Google Analytics dashboard, you really need to determine the goals of your website. If you need help with setting up Goals and Conversions, then check out my post on Setting Goals.
If you’ve never set up analytics on your website/blog, you’ll need to do that first. You can learn how to do that from Google with their setting up Google Analytics on your website post.
To build a custom dashboard, it’s fairly easily. But why would you want to, you know, since Google already provides large tabs with the analytics on them. Mainly because you probably don’t have a lot of time to be digging through all those analytics. Your own dashboard will help you get right to the meat of your needs.
1. Log in to Google Analytics
It’s as simple as going to Google.com/analytics
2. Select the profile
You might not have to select a profile if you only have one website. If you are already on the Audience Overview, just skip to Step 3.
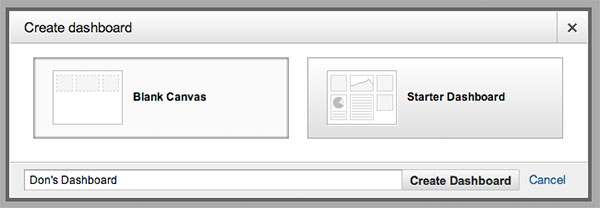
3. Select New Dashboard
This will be on the top left navigation. You can create up to 20 custom dashboards.

4. Select Blank Canvas
You’ll be able to create and move all the widgets you create so the dashboard will look exactly as you want it to look.
5. Select Add a Widget
Once you click, add a widget you’ll get a pop-up on the page that will help you define each and every widget you want to create.
First you’ll need to fill out the Widget’s name.
The second thing you’ll need to select is what type of widget reporting this will be. Do you want:
Metrics – just a simple figure or calculation.
Timeline – a visual timeline with metrics.
Geomap – a visual map color coded for the metrics.
Table – several metrics tied together in a table format.
Pie – a visual pie chart of the metrics.
Bar – a bar chart of the metrics.
If you select Standard, these metrics will be tied to the time slot you select on the top right.
If you select Real-Time, these metrics will be tied to only real time data and will constantly be changing depending on the real time traffic to the website.
Once you select the visual, the “show the following metric:” will change depending on the visual.
You can also use “Filter this data” to show/don’t show different dimensions with different expressions like “containing”, “exactly matching”, “ends with”, etc…
The last option, “Link to Report or URL” gives you the possibility to link directly to a standard Google Analytics report or a URL within the widget.
Then you would click “Save”.
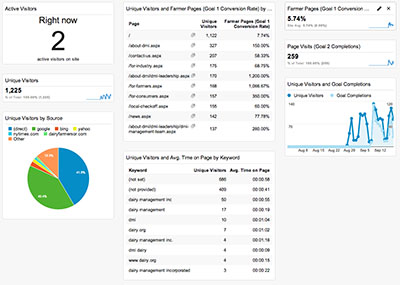
Here are the following widgets I would set up for dairy industry or farming website. These will make it easier on you to see at a snapshot what is going on.
6. Real Time Active Visitors – how many people are on the website right now.
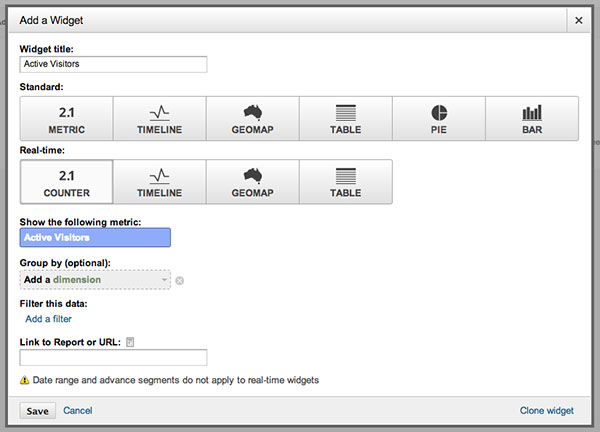
Name the widget “Active Visitors”
Select Real-time 2.1 Counter
Select Following Metric: Active Visitors
No dimension
No filter this data
No link
Click “Save”

The above image is what the widget should look like.
7. Unique Visitors – how many unique people have been on the site in the timeframe at the top right

Name the widget “Unique Visitors”
Select Standard 2.1 Metric
Select “Unique Visitors”
No filter
No link
Click “Save”
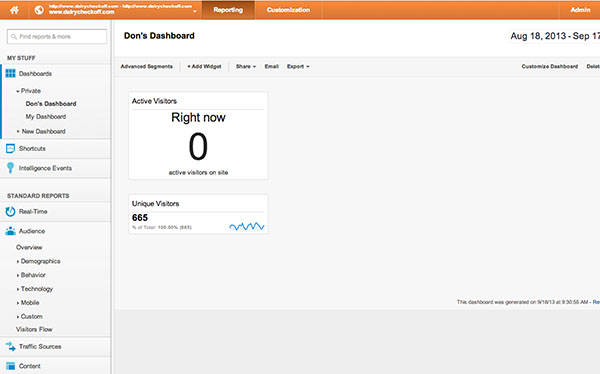
The above image is what the widget should look like. As you probably noticed, this widget is then on top of the first widget you created. You can drag this widget down under the other widget by simply grabbing the top bar of the widget.
8. Unique Visitors by Source – where are my unique visitors coming from (direct, search engines, websites, etc…)

Name the widget “Unique Visitors by Source”
Select Standard “Pie”
Select “Unique Visitors”
Select “Source”
Show up to 5 slices
No filter
No link
Click “Save”

The above image is what the widget should look like.
9. Unique Visitors by Content Page and Contact Us (Goal 1 Conversion Rates) – this will tie how many of your unique visitors visited a certain page and then also converted one of your goals
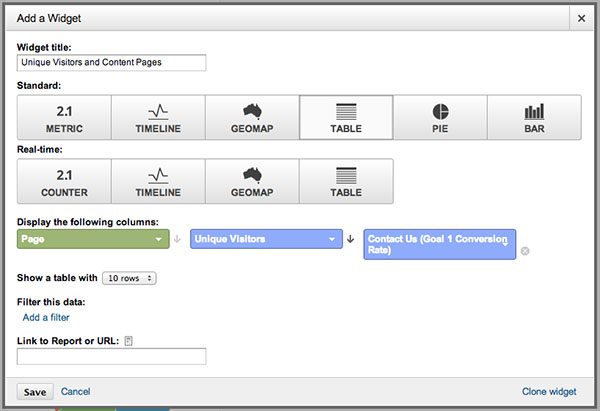
Name the widget “Unique Visitors and Content Pages by Contact Us” if that is your goal.
Select Standard “Table”
Select “Page”
Select “Unique Visitors”
Select “Contact Us (Goal 1 Conversion Rate)” if this is your goal
10 rows is fine
No filter
No link
Click “Save”

The above image is what the widget should look like.
10. Unique Visitors and Average Time on Page per Keyword – this will show you how many unique visitors used what keyword to get to your website and how long they stayed on the page.

What does “not set” mean? Well, it’s kinda confusing but Google tries to clear it up with their explanation. To me, it’s tough to tell but basically Google is missing the dimensions it needs to determine the keyword.
What does “not provided” mean? This means that the user was logged into Google and was securing using search so the keywords are not passed along to Google Analytics. This is for privacy but you can “unlock” these keywords through these steps by KISSmetrics.
Name the widget “Unique Visitors and Avg. Time on Page per Keyword” if that is your goal.
Select Standard “Table”
Select “Keyword”
Select “Unique Visitors”
Select “Avg. Time on Page”
10 rows is fine
No filter
No link
Click “Save”

The above image is what the widget should look like.
11. Contact Us (Goal 1 Conversion Rate) – this will show you how many times your goal converted.

Name the widget “Contact Us (Goal 1 Conversion Rate)” if that is your goal.
Select Standard “2.1 Metric”
Select “Contact Us (Goal 1 Conversion Rate)”
No filter
No link
Click “Save”

The above image is what the widget should look like.
12. 3 min or more (Goal 2 Conversion Rate) – this will show you how many times a unique visitor stayed on the site for 3 minutes or more.

Name the widget “3 min or more (Goal 2 Conversion Rate) ” if that is your goal.
Select Standard “2.1 Metric”
Select “3 min or more (Goal 2 Conversion Rate) ”
No filter
No link
Click “Save”

The above image is what the widget should look like.
13. Unique Visitors and Goal Completions – this will show in timeline form the number of unique visitors and how many times there was a goal completion.

Name the widget ” Unique Visitors and Goal Completions”.
Select Standard “Timeline”
Select “Unique Visitors and Goal Completions”
Select “Unique Visitors”
Select “Goal Completions”
No filter
No link
Click “Save”

The above image is what the widget should look like.
There you go – eight different graphs to quickly view how your website is doing on your own personal dashboard.
And of course, if these don’t meet your needs you can add many more widgets customized to your specifications.
In a future post, I’ll go over the main sections of Google Analytics that are important to dive into as well like Content – All Pages and Landing Pages.
And I’ll also look into custom reports – there are many good ones out there that other people have created – and how to add them as well.
If you have any questions, or want to add your own, just let me know by leaving comments below or contact me via your favorite social net. All my connections are on the right.
Leave a Reply